XGBoost for Regression
Tutorial on XGBoost for Regression
We Love Regression
Regression is a model that I am incredibly familiar with, and feel as though I am quite experienced with. I have used regression models to predict, as well as to explain data. In a recent project of mine, I was faced with a dataset that had more than 20 independent variables, and one contiuous variable. Wanting to mix things up, I looked up different algorithms that I could use to predict this continuous variable. After one quick search on kaggle, I was introduced to XGBoost algorithm, a model that regularly wins kaggle competitions.
What is XGBoost?
XGBoost is short for eXtreme Gradient Boosting, which is an advanced gradient boosting algorithm that uses decision tree ensembles. Boosting is a topic that can be explored in depth, but for the sake of this blog post, I will keep it simple. Boosting is a method that combines multiple weak learners to create a strong learner. A weak learner is a model that is slightly better than random guessing. A strong learner is a model that is better than random guessing. The idea behind boosting is to create a strong learner by combining multiple weak learners. The way that boosting combines weak learners is by creating a new model that focuses on the errors of the previous model. This process is repeated until the model is strong enough to be used for predictions.
I had no idea that XGBoost worked well for regression. I was originally looking to use decision tree learning as a variable selection method for a linear regression model. However, after fitting an XGBoost model, I found that it outperformed my linear regression model. It was a cool learning experience for me to see decision tree learning outperform a regression model.
Data Preparation
The dataset that I was using had both continuous and binary variablees. It is important to note that XGBoost does not accept categorical variables. If you want to include categorical variables, you need to implement one-hot encoding. Otherwise, it may be better to use a similar boosting algorithm called CatBoost, which accepts categorical variables.
It is important to set the seed at the beginning of your code, because there is a lot of randomness in the XGBoost algorithm. I set the seed to 42, which is the answer to life, the universe, and everything (long live Jackie Robinson).
I split the data into training and testing sets using a 70/30 split. I changed the training and testing sets into a DMatrix object. This is a data structure that is optimized for XGBoost. A DMatrix object includes the train/test data as well as the train/test labels in the same object. Using a DMatrix object is not required, but it is recommended (according to the internet, which is never wrong).
Fitting the Model
I then used leave-one-out cross validation to find the optimal parameters for the XGBoost model. Since we are predicting a continuous variable, I used the root mean squared error (RMSE) as the evaluation metric. Perferably, I would used AIC or BIC, because I was wanting to only the variables that were necessary, but that is not a metric that is available in XGBoost. If you are feeling extra ambitious, you can create a custom evaluation metric. In my cross validation, I optimized the following parameters:
- nrounds: the number of boosting rounds
- max_depth: the maximum depth of each tree
- eta: the learning rate
- gamma: the minimum loss reduction required to make a further partition on a leaf node of the tree (this is a regularization parameter for decision trees)
- colsample_bytree: the fraction of columns to be randomly samples for each tree
- min_child_weight: the minimum sum of instance weight (hessian) needed in a child
- subsample: the fraction of observations to be randomly samples for each tree
You can read more about these parameters in the XGBoost documentation.
The leave-one-out cross validation process took about two minutes to run (loocv will not be the best approach for large datasets). The RMSE and Rsquared values were significantly better than my linear regression model.
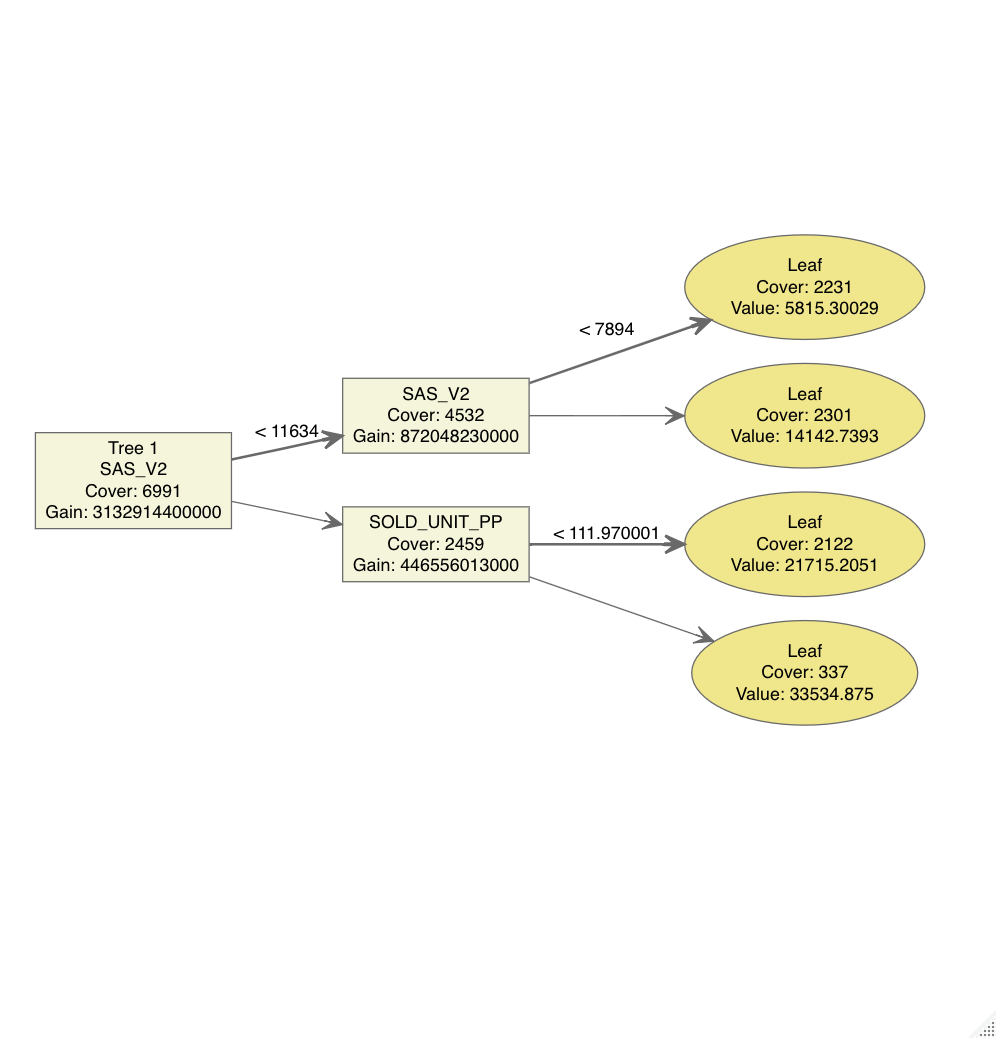
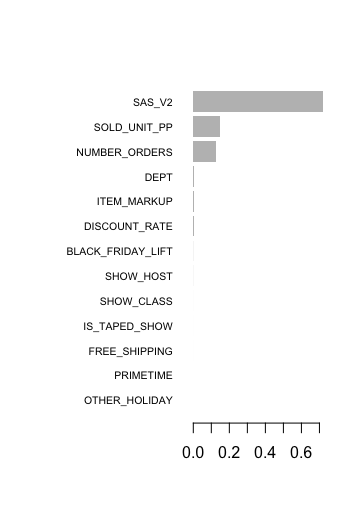
One of the coolest things about decision tree learning is that it is very easy to interpret. If I were to try and calculate variable importance in a linear regression model, it would be difficult to do if I couldn’t standardize all of the variables. There are a few ways variable importance can be calculated, with each method having its pros and cons. The XGBoost has built-in functions to visualize variable importance, and the decision tree of your model. Attached are the variable importance plot and decision tree plot for one of the more optimal models (the most optimal model had a more complicated tree, which was bigger and harder to visualize, so I am showing a more simple tree for visualization purposes).
Decision Tree:
Variable Importance:
This is all I will cover for now, but don’t forget the other important steps in the machine learning process (model validation, predictions, etc.).
Cheers!